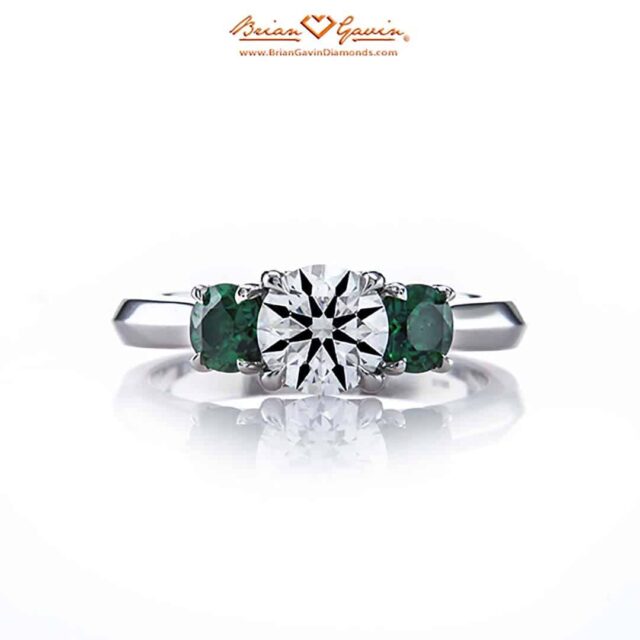
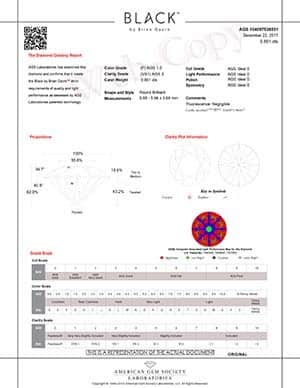
"Todd, It is quite daunting and confusing, wading through all of the diamond information. Also, it seems quite inadequate to evaluate a diamond without actually seeing it. With this in mind, I have a few questions:
1. On the AGS light performance document, is it optimal to have the center of the diamond diagram color red? I notice that a lot of ASET Scope images have "green" in the middle while others have red. Does it make a difference?
2. Is it better to have the pavilion angle in the lower range? Can you please provide your expertise on the following diamonds we are considering?"
~ Cindy S. (diamond details appear below)
How to Buy a Diamond with Confidence Using ASET:
In the first place, it is possible to predict diamond light performance and sparkle factor with the right insight. Not only that, but we can do so with great accuracy using standard gemological tools and principles:
Although this may be true, you have to know how to interpret the data in order to benefit from it. Otherwise, you're just looking at the pretty pictures without understanding their meaning. Of course, that might be what some vendors are counting on.
As a matter of fact, I'm certain that this is true because most ideal diamonds exhibit light performance issues. And yet, people buy those diamonds thinking that they're top performers because they can't interpret the images.
Be that as it may, it doesn't take me long to evaluate a diamond using ASET, H&A, and Ideal Scopes. In fact, that is something that I can do fairly quickly after working 30+ years as a professional diamond buyer. So please feel free to ask me to look over the details of any diamonds which you are considering.
What Do the Colors Red, Green, and Blue Indicate in an ASET Scope Image?
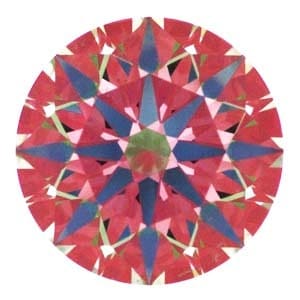
The ASET uses the colors red, green, and blue to represent different intensities of brightness and contrast. It uses the tones black and white to indicate light leakage.
Each color is used to represent a different range or angle of light within the spectrum of the earth's hemisphere. The color red represents the brightest light source in the room.
While the color green is an indication of secondary brightness. The color blue represents contrast which enables us to distinguish between the different sections of a diamond.
What is an ASET Scope And What Does It Tell Us About a Diamond?
As stated previously, the American Gem Society Laboratory (AGSL) uses the Angular Spectrum Evaluation Tool (ASET) to measure light performance. The ASET Scope enables us to measure the relative brightness of a diamond. At the same time, it enables us to determine how effectively a diamond is making use of the light available.
In addition, we can use the ASET Scope to see how evenly light is reflecting throughout a diamond. On the other hand, ASET Scope images often reveal how unevenly a diamond may be reflecting light. With this in mind, diamond dealers may be hesitant to provide reflector scope images because they are a double edge sword.
The AGSL created Angular Spectrum Evaluation Technology in conjunction with the University of Arizona. The ASET is the result of years of research and development. The development team consists of experts from the AGSL and renowned optical physicist, Dr. José Sasián from the University of Arizona.
The AGS Angular Spectrum Evaluation Tool is the industry standard for light performance. The patented technology is the only process using ray tracing that is peer reviewed and scientifically vetted.
Prior to the inception of ASET, using mathematical ray tracing to estimate the light performance of a round brilliant cut diamond (RBCD) only took 17 of the 58 facets into account:
The labs use Sarin Technology to measure the diamonds and determine the angles and percentages. Then the proportions of the diamond are used to determine the cut grade along with polish and symmetry.
As a matter of fact, the GIA Gem Trade Laboratory still does it this way. While the AGS Performance-based grading platform measures all 58 facets and evaluates the diamond in three dimensions.
How to Read ASET Scope Images and Know What the Colors Mean:

The first thing to remember is that the ASET Scope uses colors to represent different intensities of brightness and contrast. The color red represents the brightest light in the room reflecting back towards the observer.
Secondary brightness appears as the color green while blue indicates contrast. Each color represents a different spectrum or angle of light within the hemisphere.
By the way, the light pink semi-translucent areas indicate light leakage under the table facet of this GIA Excellent cut diamond. As you can see, it's nearly full-blown in the relative 4 o'clock and 10 o'clock positions.
At the same time, the ASET Scope is showing light pink all around the edge of the table facet. In other words, this ideal cut diamond is leaking light under the table facet. In addition, notice the splotches of green reflecting under the crown facets. Those upper girdle facets should be red in color and thus we know this diamond lacks optical precision.
Red = Brightness:
Reddish hues indicate light that is striking the diamond perpendicular to the table facet up to 45 degrees. This is the brightest spectrum of light and these sections of the diamond will be more brilliant.
If you've read my article on Tolkowsky's Diamond Design, then you know that the term brilliant refers to brightness. At the same time, we use the word brilliance to describe white sparkle. To the end that these words seem similar, they mean different things.
Green = Secondary Brightness:
The color green in an ASET Scope image is an illustration of secondary brightness reflecting throughout a diamond. It encompasses the range between 45 degrees out to the edge of the horizon.
While the green zones are technically less bright than red sections, they are still bright. In other words, bright light reflects throughout the diamond as green and light which is even brighter appears as red.
Blue = Contrast (Black and White Indicate Leakage)
At the same time, the slight difference between the different intensities of light serve to increase contrast. This is a good thing seeing that contrast is a critical factor of light performance within a diamond. Remember that contrast is the difference in shades of tone and color which enable our eyes to see depth.
On the other hand it's important to distinguish between the colors black and white and contrast which is blue. The tones black and white in an ASET Scope image indicate light leakage. While the color blue represents contrast.
As an illustration of the concept, you'll see that the arrows pattern in a round brilliant diamond are blue. In contrast, the other sections of facets will be red or green. Coincidentally, it is the contrast between the intensity of light reflecting within the diamond that make it beautiful.
How Cutters Use ASET To Improve Diamond Cut Quality:
The pavilion angle of a diamond dictates the volume of light return. In the same way, the crown angle and height will affect the balance of brilliance and dispersion.
By the same token, the consistency of facet alignment will determine how evenly light reflects throughout the diamond. To say nothing of how the skill of the cutter factors into the equation.
The overall cut grade of a diamond can influence the price by up to sixty percent. Which means that it's in the best interest of the cutter to achieve AGS Ideal or GIA Excellent.
However, it's even more difficult to produce diamonds that score AGS-0 Ideal for light performance. Consequently, the ASET Scope image to the left for this 1.701 carat, H-color, VS-2 clarity, Brian Gavin Signature diamond looks amazing. Does it not?
Most people don't realize that it takes up to 4X longer to polish diamonds to this degree of optical precision. With this in mind, it's easy to see why these H&A diamonds cost more than standard ideal cuts:
As a matter of fact, it can take as much as one more day to produce each Black by Brian Gavin diamond. It's important to remember that the cutting process for the Black by Brian Gavin Diamonds is so unique that it is patented.
Special care is taken to fine tune the minor facets to increase the sparkle factor. At the same time, it takes longer to polish the facets to a bright, smooth finish.
What does a mixture of red and green mean in an ASET image?

It's important to remember that it's perfectly normal for the middle of the ASET image to be red or green. As a matter of fact, the middle of a diamond might be red, green or a combination of both colors. The reason is because the two colors share the edge of the 45° spectrum, which separates the two colors.
If you look at the ASET scope pictured to the left, you will see that the two sections of red and green are connected. Therefore any light which enters the diamond along the seam may appear either red, green, or a combination thereof.
The color blue represents contrast which is what enables our eyes to see. This is light which could enter the diamond. However, it will end up being blocked by our heads (or a camera lens) as we observe the diamond.
While it is normal for an ASET image to show red and green in the center the two colors should be separate. In other words, there should be clear lines of division between red and green. To put it differently, the separation of colors should be distinct and not softly mixing together. We will discuss this concept in more detail further down the page, but first let's talk about contrast.
Contrast Brilliance Is Critical For Light Performance:
Let's take a moment to build a castle in the air. Something inspiring and majestic with high walls and towers which reach towards the sky. As you approach the entrance and walk through the gates you see high vaulted ceilings. At the same time there are arches upon arches and they seem to stretch out forever.

All of a sudden, your breath is taken away by the beauty and contrast of the light and dark. You can't help but watch as shades of illumination twist and dance in the shadows. Capturing your attention and tantalizing the senses beyond imagination.
And then, the mind being the way that it is, sees the white floor flowing endlessly out to the horizon. The contrast created by the kaleidoscope effect of light and dark blending together seamlessly takes your breath away.
Your vision is drawn deeper and deeper into the background towards that infinite reflection of light popping out from the darkness. Finally, you realize with a quickening on the back of your neck that you're feeling goosebumps all over.
I'm certain that this is the effect that the architects designing the historic Cloisters of Glasgow University were hoping to invoke. In the same way that diamond cutters fashion the facets of a diamond to create depth of field. The contrast brilliance that the alternating pattern of light and dark reflections creates visual impact.
Vibrant Blue Color in ASET Scope Images Is A Good Thing:
People often wonder why the arrows of a diamond appear to be blue in an ASET Scope image.The effect is the result of the blue color that appears at the top of the scope.
The placement of that section re-creates the effect of our head blocking light from entering the diamond. Of course, this scenario assumes the brightest light in the room is coming from behind you.
The shadow that your head creates reflects off of the pavilion main facets which create the arrow's pattern. By the same token, the facets of the diamond need to be at the right angle to to catch the light.
My sons engagement ring (above) contains a Black by Brian Gavin Diamond. Notice how it exhibits strong contrast brilliance which creates brightness and depth of field.
The alternating patterns of light and dark command your attention and draw your attention deeper into the stone. In this instance, what you are seeing is the dark color of the camera lens reflecting off the pavilion mains. The precise nature of the facet structure of these diamonds creates the most vivid and intense sparkle I've ever seen.
Strong contrast brilliance is especially important if you spend a lot of time under fluorescent lighting. Such as, you're likely to find in a traditional office or work environment. With this in mind, you definitely want to select a diamond that exhibits high contrast brilliance. Otherwise, your diamond might look dull and lifeless because it lacks the depth of field that grabs our attention.
Depth of Field is an Essential Performance Factor:
From that perspective, you might say that the degree of contrast brilliance will make or break a diamond. After all, the difference between a diamond that just sits there and one that dazzles the senses is contrast brilliance.
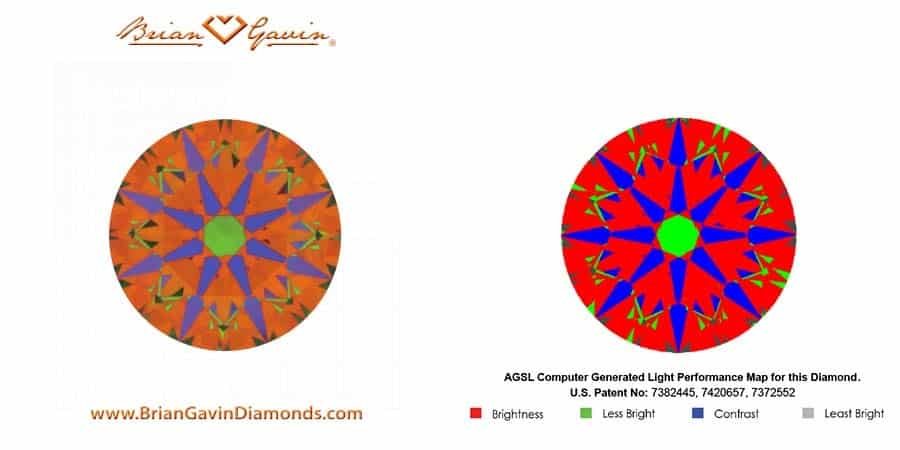
As you can see, the arrows pattern for my son's Black by Brian Gavin Diamond shows strong blue contrast. There is also a hint of blue clustering at the base of the arrows which further increases contrast.
At the same time, there is a strong presence of reds which indicate that it is very bright. As well as an even distribution of green secondary brightness throughout the stone. In addition, the solid green color in the center represents light entering the diamond at 45 degrees. Remember that diamonds may show red or green in the middle because those colors share the 45 degree line on the ASET Scope.
How to Evaluate a Diamond Using an ASET Scope:
The photograph to the left shows fifth-generation diamond cutter Brian Gavin using an ASET Scope. As you can see Brian is holding the diamond in tweezers with the light source behind it. The green, red, and blue colors of the scope reflect throughout the diamond.
Light will not reflect evenly in the event that the crown and pavilion angle offset are not in harmony. At the same time, variations in the size, shape, and/or alignment of the facets will create pattern disruptions.
By the same token, the design of the ASET Scope requires the diamond to be held at a specific distance. As you might imagine changing the distance between the diamond and the scope can alter the image considerably. Which is something that diamond dealers can use to falsely improve the appearance of their ASET Scope images.
Reengineering, Doctoring and/or Manipulating of ASET Scope Images:
ASET photographs of diamonds are usually taken using a special set-up which is available from the AGS Laboratory. At the same time, there are more elaborate imaging systems available from other companies. One of the benefits that these imaging systems provide is the ability to capture clarity and reflector scope images at the same time.
As you might expect, all of these imaging systems have their pros and cons. I got the chance to play with the system that Brian Gavin uses and its state-of-the-art. At the same time, I found it challenging to properly position the diamond because the chamber is quite small.
Apparently, the imaging system that Whiteflash uses also has some drawbacks. As can be seen by the pages below that reveal how they fix discrepancies in their ASET Scope images.
According to a Former Whiteflash Employee, This Is Their ASET Scope Issue:
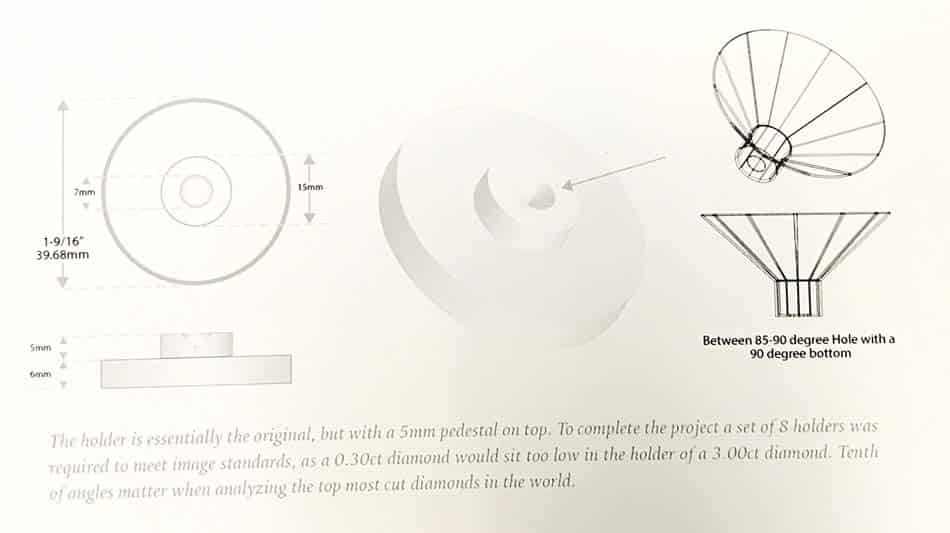
"The underlying problem was that the ASET dome used to create a diamond light performance image was designed incorrectly, so that the diamond could not sit at the correct horizon mark for an accurate image. As the dome was nonadjustable, a special holder was the solution, which elevated the diamond to the correct horizon line.”
The Former Whiteflash Employee Goes On To Explain:
"The holder is essentially the original, but with a 5 mm pedestal on top. To complete the project a set of 8 holders was required to meet image standards, as a 0.30ct diamond would sit too low in the holder of a 3.00ct diamond. Tenth of angles matter when analyzing the top most cut diamonds in the world.” Emphasis my own.

Human Logic Confuses Me.
Okay, If you're anything like me, then I suspect you can see the logic in this statement. However, at the same time, a certain part of me is screaming "Say What?!?!"
To begin with, I happen to know several diamond cutters and dealers who are also using this imaging system. None of them report discrepancies between the ASET on the lab report and the photographs.
At the same time, it stands to reason that raising the height of the diamond in the chamber changes everything.
After all, the effect of raising the diamond higher in the dome alters the angle that light strikes the diamond. Then again, a person using the handheld scope is not likely to maintain the same distance every time.
With this in mind, I'm not calling Whiteflash out for altering their ASET Scope imaging system. On the contrary, I just want you to be aware that some dealers might be manipulating their reflector scope images. In light of this discovery, you might want to place more emphasis on the ASET that the AGSL provides on the lab report.
How Distance Affects Perception of ASET Scope Images:
As you're aware, they say that a picture is worth a thousand words. With that in mind, let's look at the difference between ASET photographs and lab results. Here is the ASET Scope photograph for a Whiteflash diamond along with the image from the lab report:
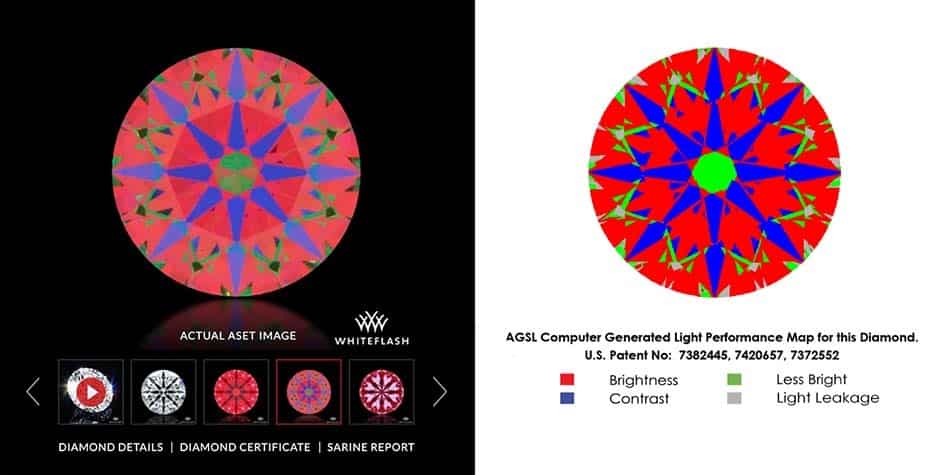
Let's begin with the understanding that a photograph will never match a digital representation exactly. At the same time, it's reasonable to expect that certain characteristics of the diamond should remain consistent. After all, people are likely to use these images as part of their evaluation process.
The first thing that stands out to me when I look at the photograph on the left is the difference in hue and saturation. From this perspective, the red color appears stronger under the table facet which indicates a higher degree of brightness. The red color throughout the crown section on the outer edge is lighter, but it should be the same tone.
Look at the consistency of red in the ASET image on the right which is from the lab report. In addition, notice how the center of the diamond is all green in the image from the AGSL. While the center of the diamond shows a mixture of red and green in the photograph on the left.
Although this may be true, that's not what I'm really curious about. After all, some of these differences can result from slight variations in camera settings and focal depth. Be that as it may, what I want to know is where did the blue clustering at the base of the arrows go?
In Search of Consistency with ASET Scope Images:
As shown above, there can be distinct differences in ASET Scope results. With this in mind, I suggest that you don't get caught up in the minutia. These reflector scope images are meant to help you identify substantial issues that might affect light performance. Slight differences in hue and saturation should not be cause for concern.
At the same time, I like to see some consistency in the pattern of light return and characteristics. Let's take this Black by Brian Gavin Diamond as an example:
As you can see, the ASET Scope images look quite similar. While there is obviously a difference in color, the degree of hue and saturation appears constant. The intensity of orange under the table facet on the left is equal to the intensity of red on the right. At the same time, in both instances, the distribution of color remains even from the table through the crown facets.
Both ASET Scope images show green in the middle of the table facet in equal amounts. In addition, the absence of clustering at the base of the arrows is apparent in both images. Which leads me to believe that these two imaging systems are producing similar results.
Differences In ASET Scope Imaging Systems:
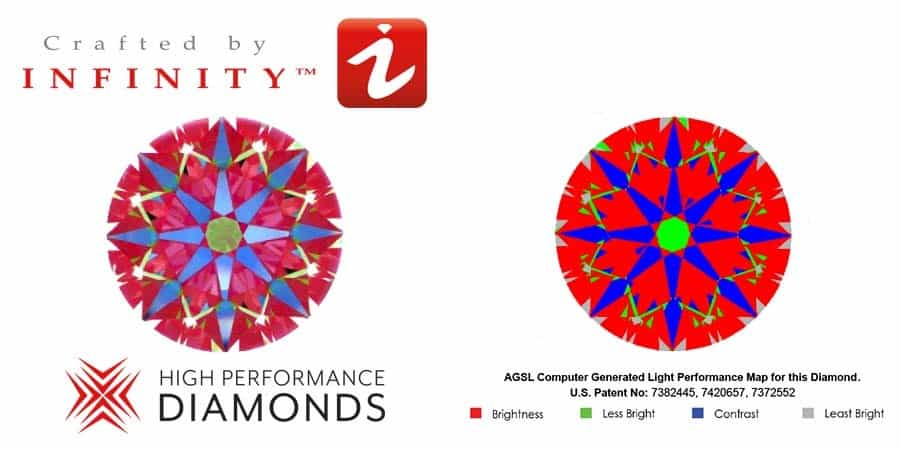
The ASET Scope images for the Crafted by Infinity diamond below are interesting because of the similarities and differences. In the first place, the pattern of light reflecting throughout the diamond is comparable in both images. However, the region under the table facet is much lighter in the photograph on the left. If I didn't know better, I might be led to believe this diamond is leaking light.
Of course, we know for certain that this Crafted by Infinity diamond is not leaking that much light. In the event that it was leaking light it would be evident in the ASET image on the right.
With that in mind, let's focus on the consistency of the pattern of light reflecting throughout the diamond. Take note of the similarity in the arrows patterns and the green outline along the edge of the star facets. As a matter of fact, the biggest difference is the absence of clustering on the left.
As it so happens, I happen to know that CBI/HPD is not using a state-of-the-art imaging system. This is a fact that leaves them at a bit of a disadvantage against their competitors. At the same time, these images are a vast improvement over the image quality from before. Needless to say, the image on the lab report is your best bet for Crafted by Infinity diamonds.
Adjusting For Differences In Hue and Saturation of ASET Scope Images:
In the same fashion as the images above, the ASET for this diamond from Victor Canera shows some differences. At first glance, you're likely to notice the difference from orange to red. Once again, this is not worth a second glance. Rather, you should focus on the pattern of light reflecting throughout the diamond.
For the purpose of this tutorial, I want you to look for similarities and differences between these two images. It's important to pay attention to how light is reflecting under the table facet. With this in mind, do these two ASET images look similar? Or are their distinct differences in the patterns of light return?
Regardless, it doesn't matter because I'm going to err on the side of caution and go with the ASET on the lab report. As you can see, the ASET on the DQD indicates some clustering at the base of the arrows. Whereas the photograph on the left does not reveal that characteristic.
At the same time, it's important to note that some clustering at the base of the arrows is normal. Arguably, a light amount of clustering increases contrast. Given these points, it's not the clustering that caught my attention, but rather the difference between these ASET images.
Where To Buy Aset Scope Online:
As you are now aware, the only standard for ASET Scope images are those from the AGS Laboratory. The unfortunate reality is that every dealer is using a different imaging system with varying degrees of accuracy. With that in mind, it makes sense that you might want your own ASET Scope.
You can buy an ASET from the AGS Laboratory or from the people who sell the Ideal Scope. The price is the same, but the latter option has some pretty cool kits available.
I hope that of you enjoy reading this tutorial and find the information useful. Please leave a comment below. At the same time, I invite you to take advantage of our Free Diamond Concierge Service. We can help you search for diamonds and/or double check the details for you.

